
Ontario Real Estate Outlook Amid Geopolitical and Economic UncertaintyExecutive summaryOntario’s resale housing market is still working through a multi-year affordability reset, and February

Dated: March 25 2026
Views: 178
Ontario’s resale housing market is still working through a multi-year affordability reset, and February 2026 data show demand remains subdued while inventory stays elevated. Provincewide sales were 9,425 (down 8.1% y/y) and the average price was $802,601 (down 5.2% y/y), with active listings at 49,884 and months of inventory at 5.3—well above Ontario’s long-run seasonal norm.
The “big picture” of uncertainty has intensified. The Bank of Canada held its policy rate at 2.25% on March 18, 2026, explicitly citing the Iran war’s impact on energy prices and broader financial conditions, while noting Canada is still adjusting to U.S. tariffs and trade policy uncertainty.
Even so, there are tangible signs of improvement worth watching: inflation has cooled (CPI 1.8% y/y in February), affordability has improved from the 2022 peak, and several Ontario markets are showing early “bottoming” behaviors—inventory no longer surging everywhere, some benchmarks stabilizing month-to-month, and buyers receiving more choice and negotiating power.
Ontario in February 2026 looked like a market with soft demand and ample selection, especially compared with the 2021–2022 boom. The average-price history makes the point visually: Ontario’s average price peaked in early 2022 and has since drifted lower and sideways as rates normalized.
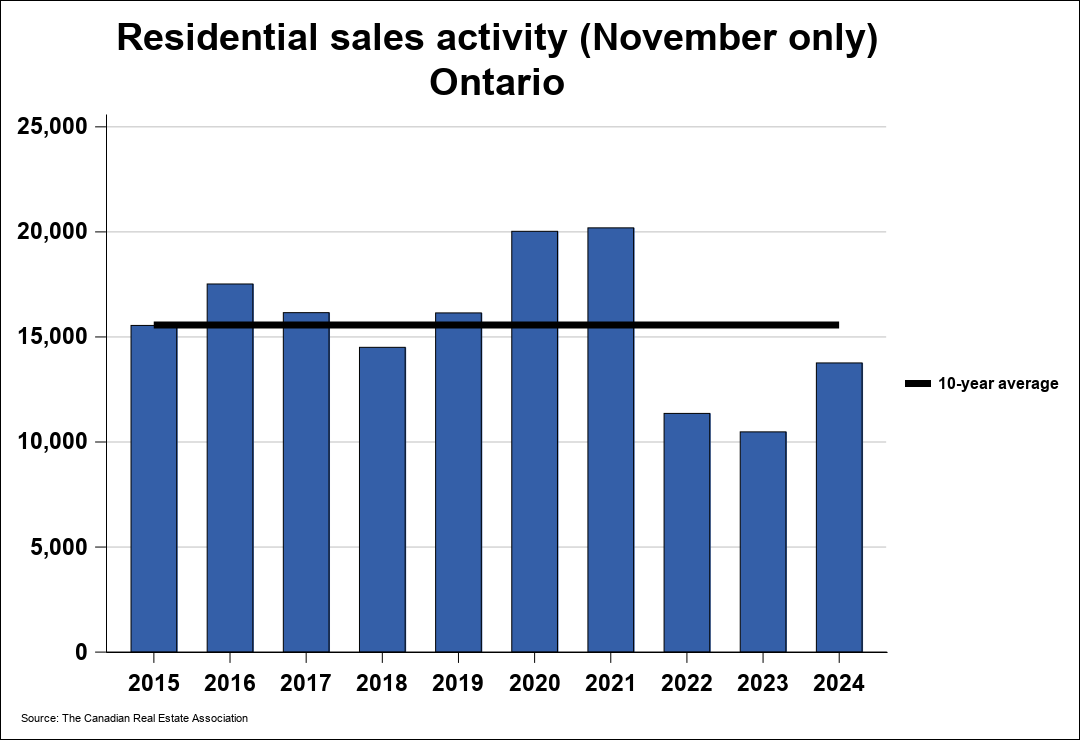
At the same time, February sales volumes remain below the pre-pandemic norm.
A crucial Ontario-wide “market balance” signal is the relationship between sales and new listings. Ontario had 24,145 new listings vs. 9,425 sales in February—an implied sales-to-new-listings ratio around 39% (9,425 / 24,145). CREA commonly frames ~45%–65% as consistent with balanced conditions, so Ontario is still leaning “buyer-favouring” at the provincial level.
Regional differences inside Ontario remain sharp. On CREA/OREA’s regional breakdown, Central Ontario (which includes Greater Toronto and nearby areas) posted the highest average price ($1,019,988) versus Northern Ontario ($461,137) and Eastern Ontario ($620,022).
All figures are February 2026 unless noted.
How to read this: Toronto/GTA is still the high-price, high-sensitivity market; some suburbs show inventory “unwinding” but still elevated; several smaller and mid-sized cities (Ottawa especially) look closer to balanced, while others (Niagara, parts of Southwestern Ontario) still show buyer-leaning supply.
Interest rates are still the dominant “gearbox” for Ontario housing because the province is both highly indebted (mortgages) and rate-sensitive (high price-to-income ratios in the GTA). The Bank of Canada held at 2.25% in March, but the decision is explicitly framed as a balancing act: weaker growth and soft labour markets versus higher inflation risks from the energy shock.
Inflation has recently been supportive. Canada’s CPI cooled to 1.8% y/y in February, with shelter inflation at 1.5% y/y, and gasoline down 14.2% y/y (even as it rose month-to-month in February before the war’s full effect). Lower inflation is a classic pre-condition for rate cuts and improved mortgage affordability—though the Iran war is now a wildcard for the next CPI prints.
The labour market is a second key swing factor. National employment fell 84,000 in February and the unemployment rate rose to 6.7%; Ontario’s unemployment rate rose to 7.6%. Softening employment tends to reduce household confidence and upgrade activity, especially in high-priced regions.
Migration has turned from a tailwind to a headwind. Statistics Canada’s preliminary estimates show Canada’s population fell in 2025 and Ontario recorded one of the larger quarterly declines (Q4 2025), driven in part by a drop in non-permanent residents. CREA/OREA’s migration dashboard also shows Ontario experienced a net population decrease in Q3 2025, including negative net international migration. Slower population growth can ease rental pressure and temper investor demand, but it also reduces organic housing demand growth.
On supply, CMHC reports Canada’s seasonally adjusted annual rate of housing starts was 256,005 in February 2026, with multiple uncertainties weighing on future activity (trade impacts, construction costs, and planning/approval timelines). This matters for Ontario because a prolonged starts slowdown today becomes a resale tightness problem later, even if today’s market feels “well supplied.”
The Iran war hits Ontario housing mostly indirectly, through inflation expectations, interest rates, and confidence. The Bank of Canada states that oil and natural gas prices “have risen sharply,” that this will “boost global inflation in the near-term,” and that effective closure of the Strait of Hormuz could create transportation bottlenecks impacting other commodities (including fertilizer). That is a classic supply-shock mix: higher input costs plus higher uncertainty.
Markets are already reacting in real time. News reports show oil has been volatile, dipping on ceasefire optimism after spiking toward the $100–$120 range. For Ontario homeowners, the practical translation is “mortgage-rate turbulence risk”: if energy-driven inflation sticks, central banks can be forced to hold rates higher for longer, even with weak growth.
Tariffs are the other major transmission channel and they are unusually direct for Ontario because of cross-border manufacturing and construction inputs. In its January 2026 outlook, the Bank of Canada is explicit that U.S. trade restrictions have disrupted the Canadian economy, causing structural adjustment and a persistent negative GDP impact versus prior forecasts.
On the U.S. side, official actions now include broad-based tariff tools. For example, the White House issued a proclamation imposing a 10% ad valorem import surcharge effective February 24, 2026 (with defined exceptions and an intended end date in July 2026 unless changed).
Construction costs and timelines are another link. Tariff regimes on steel/aluminum and downstream “derivative” products create cost volatility for everything from rebar to HVAC components. A detailed Federal Register proclamation on Section 232 actions describes steel and aluminum tariff increases—underscoring the policy risk around building-material pricing.
A useful way to think about Ontario housing under “tariffs + war” is that Ontario bears much of the inflation pain without the growth upside that higher oil prices can provide to energy-producing provinces. That asymmetry is one reason the Bank of Canada’s reaction function is so important for Ontario: rates may not fall if inflation re-accelerates, but Ontario may still feel the growth slowdown.
History suggests geopolitical shocks rarely move Canadian housing directly—they matter when they change domestic fundamentals: inflation, interest rates, and employment. Central banks explicitly remember the 2022 energy shock that followed Russia’s invasion of Ukraine, and that experience has made policymakers more cautious about “second-round” inflation effects.
In real estate terms, these shocks typically widen the “bid–ask spread” (sellers anchored to old prices; buyers hesitant), slowing transactions first and prices second. That mechanism is visible today: RBC describes Toronto as still buyer-favouring with elevated inventory, while BMO argues the market’s bid–ask spread is gradually narrowing as affordability improves—but with limited upside for prices while uncertainty remains high.
The next 6–18 months are best framed as a rate-and-confidence problem more than a pure supply problem.
Most likely scenario: slow stabilization, uneven across Ontario
If the Iran war de-escalates without prolonged Hormuz disruption and tariff policy does not materially escalate, Ontario likely sees a modest recovery in sales later in 2026—more a “thaw” than a boom. TD expects a “gradual, modest recovery” in 2026, restrained by uncertainty, a subdued job market, and interest-rate leveling.
Best case: de-escalation + tariff clarity + modest rate relief
A ceasefire that pulls energy prices down and credible tariff rollbacks (or durable exemptions) could let inflation stay near target and reopen the door to lower mortgage rates. Even without big price gains, improved affordability could raise transaction volumes and reduce months of inventory—particularly in the GTA where new listings have already pulled back sharply.
Worst case: prolonged energy shock + tariff escalation + job losses
If Hormuz disruption persists, oil stays elevated, and tariffs broaden (or remain unpredictable), inflation could rise while growth weakens—pushing the Bank of Canada to hold or tighten into economic softness. In that environment, Ontario’s high-inventory condo segments and heavily leveraged owners become the key vulnerability, while transaction volume remains suppressed.
(Scenario framing anchored in BoC’s risk language on energy shock + tariff uncertainty and major-bank/base-case outlooks.)
Leading indicators and data sources: Watch (a) BoC rate decisions and MPR risk language, (b) StatsCan CPI—especially gasoline and shelter—plus labour data, (c) CREA/board-level sales, new listings, active listings and months of inventory, (d) CMHC starts and under-construction pipelines, and (e) official U.S. tariff actions (White House proclamations, USTR updates, Federal Register notices).
For buyers, the opportunity set is still defined by selection and negotiating room in many Ontario markets, with months of inventory around 5+ in Ontario overall and higher in some regions (e.g., Niagara), while Ottawa looks closer to balanced. The risk is rate volatility if the energy shock reignites inflation. Consider a purchase plan that survives both: conservative qualification, longer closing buffers, and a clear “walk-away” price.
For sellers, 2026 increasingly looks like a precision-pricing year. Where inventory is elevated, the winning strategy is to be the best-priced option in your micro-neighbourhood (not the whole city) and to reduce buyer friction (pre-inspection, flexible closing, well-documented upgrades). In the GTA, new listings fell materially year-over-year—if that persists into spring, competition among buyers can return quickly for well-priced homes.
For investors, focus on cash flow realism. BMO highlights that investor appetite has been muted and that a wave of rental supply (purpose-built and investor-owned completions) can pressure rents—especially in high-concentration condo markets. Under tariff and war uncertainty, underwriting should include higher vacancy and renewal-rate stress tests, not just hoped-for capital gains.
For policymakers, the near-term “win” is reducing uncertainty and delays that amplify shocks: accelerate approvals, stabilize fees/charges where possible, and protect construction supply chains from tariff pass-through where feasible. CMHC expects starts to slow (with larger declines later), so keeping viable projects moving during a demand lull can prevent a deeper supply crunch in 2027–2028.

I have been in the industry since 2011 and make it my goal to continue to grow my knowledge to protect my client's needs. I live in Napanee and work in Napanee, Prince Edward County, and Quinte Region....
Ontario Real Estate Outlook Amid Geopolitical and Economic UncertaintyExecutive summaryOntario’s resale housing market is still working through a multi-year affordability reset, and February
How to Know When It’s Time to DownsizeDon’t Wait Until It’s Too LateFor many homeowners in Napanee, Belleville, and Prince Edward County, the idea of downsizing can feel
Many of my clients are moving from hours away — sometimes from the GTA, Ottawa, or even out of province. When you're relocating to a new community, Google can only tell you so much.You might
Are You Buying a House for You… or for Everyone Else?Honest Real Estate Advice in Napanee, Belleville & Prince Edward CountyAs a Realtor in Napanee, Belleville, and Prince Edward County,
 Toronto Real Estate Board (TRREB); All information deemed reliable but not guaranteed. All properties are subject to prior sale, change or withdrawal. Neither listing broker(s) or information provider(s) shall be responsible for any typographical errors, misinformation, misprints and shall be held totally harmless. Listing(s) information is provided for consumer's personal, non-commercial use and may not be used for any purpose other than to identify prospective properties consumers may be interested
in purchasing. The data relating to real estate for sale on this website comes in part from the Internet Data Exchange program of the Multiple Listing Service. Real estate listings held by brokerage firms other than REMAX Hallmark First Group Realty Ltd may be marked with the Internet Data Exchange logo and detailed information about those properties will include the name of the listing broker(s) when required by the MLS. Copyright ©2026 All rights reserved.
Last Updated: September 22, 2026 4:55 AM UTC
Show More...
Toronto Real Estate Board (TRREB); All information deemed reliable but not guaranteed. All properties are subject to prior sale, change or withdrawal. Neither listing broker(s) or information provider(s) shall be responsible for any typographical errors, misinformation, misprints and shall be held totally harmless. Listing(s) information is provided for consumer's personal, non-commercial use and may not be used for any purpose other than to identify prospective properties consumers may be interested
in purchasing. The data relating to real estate for sale on this website comes in part from the Internet Data Exchange program of the Multiple Listing Service. Real estate listings held by brokerage firms other than REMAX Hallmark First Group Realty Ltd may be marked with the Internet Data Exchange logo and detailed information about those properties will include the name of the listing broker(s) when required by the MLS. Copyright ©2026 All rights reserved.
Last Updated: September 22, 2026 4:55 AM UTC
Show More...

The listing data displayed is deemed reliable but is not guaranteed accurate by CREA®. Data last updated on September 22, 2026 5:55 AM UTC The trademarks REALTOR®, REALTORS®; and the REALTOR® logo are controlled by The Canadian Real Estate Association (CREA®) and identify real estate professionals who are members of CREA®. Used under license. The trademarks MLS®, Multiple Listing Service® and the associated logos are owned by The Canadian Real Estate Association (CREA®) and identify the quality of services provided by real estate professionals who are members of CREA®. Used under license.
Show More...
 All information deemed reliable but not guaranteed. All properties are subject to prior sale, change or withdrawal. Neither listing broker(s) or information provider(s) shall be responsible for any typographical errors, misinformation, misprints and shall be held totally harmless. Listing(s) information is provided for consumer's personal, non-commercial use and may not be used for any purpose other than to identify prospective properties consumers may be interested in purchasing. The data relating
to real estate for sale on this website comes in part from the Internet Data Exchange program of the Multiple Listing Service. Real estate listings held by brokerage firms other than REMAX Hallmark First Group Realty Ltd may be marked with the Internet Data Exchange logo and detailed information about those properties will include the name of the listing broker(s) when required by the MLS. Copyright ©2026 All rights reserved.
Last Updated: September 21, 2026 9:12 PM UTC
Show More...
All information deemed reliable but not guaranteed. All properties are subject to prior sale, change or withdrawal. Neither listing broker(s) or information provider(s) shall be responsible for any typographical errors, misinformation, misprints and shall be held totally harmless. Listing(s) information is provided for consumer's personal, non-commercial use and may not be used for any purpose other than to identify prospective properties consumers may be interested in purchasing. The data relating
to real estate for sale on this website comes in part from the Internet Data Exchange program of the Multiple Listing Service. Real estate listings held by brokerage firms other than REMAX Hallmark First Group Realty Ltd may be marked with the Internet Data Exchange logo and detailed information about those properties will include the name of the listing broker(s) when required by the MLS. Copyright ©2026 All rights reserved.
Last Updated: September 21, 2026 9:12 PM UTC
Show More...